Why the question is hard
"What should a CISO board report contain?" is the question CISOs ask the week before the meeting — when the agenda is set, the slide deck is half-built, and the nagging sense has arrived that the board doesn't want what you've been making. Most board decks read like a status update for someone else's audience: eighty slides of vulnerability trend lines, a page of SIEM alert volumes, three frameworks rendered as percentage bars, and a closing "questions?" that lands on silence.
The board's silence isn't disinterest. It's that you gave them outputs when they wanted decisions. Board reports are governance artifacts. Their job is to give directors enough information to make three decisions: how much risk to carry, how much to spend, and whether the security leader is credible. Every section in a good board report either supports one of those three decisions or gets cut.
This is the contents specification: eight sections, what goes in each, and what gets left out. If you've read how to present security to the board, this is the structural companion — that post covered the communication dynamics, this one covers what literally belongs on the pages.
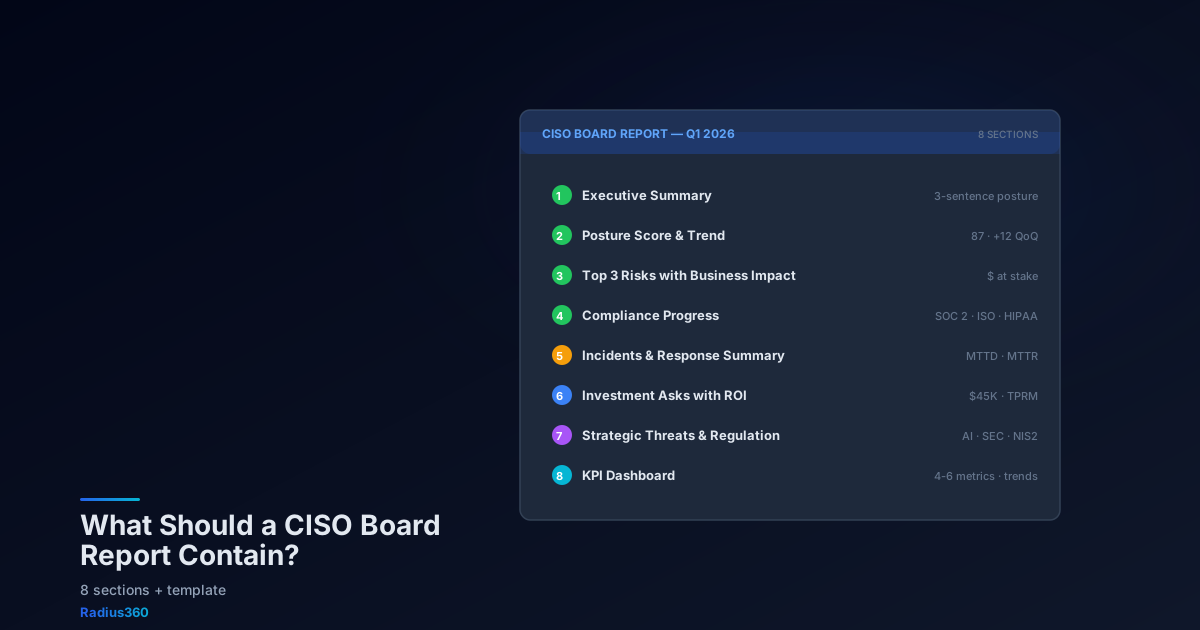
The eight sections, at a glance
- Executive summary — the 3-sentence posture
- Posture score and trend — one headline number, one QoQ delta
- Top 3 risks with business impact — in dollars, not CVSS
- Compliance progress — frameworks, what closed this quarter, what's blocked
- Incidents and response summary — what happened, what we learned
- Investment asks with ROI framing — what you need, what it buys
- Strategic threats on the horizon — regulatory, industry, AI
- KPI dashboard — 4–6 operating metrics with trend arrows
Eight sections, one page each, fifteen minutes to deliver. Anything longer is a status update; anything shorter is a tweet. This is the band where boards make decisions.
Section 1 — Executive summary
Three sentences, at the top, before anything else.
"Our security posture is stable and improving — the composite score is 87, up 12 points from Q4 and on track to the 90-by-year-end target. Top risk this quarter is vendor access review backlog, which we're closing through the TPRM program upgrade funded in Q1. I'm asking the board to approve $45K for the incident response retainer, which brings our 24/7 coverage in line with peer-benchmark SMBs in our sector."
That's the whole report compressed. If the CFO reads only those three sentences before walking into the meeting, they know your posture, your top risk, and what you're asking for. Every later section is evidence for those claims.
Avoid: the 17-bullet "highlights" section that pretends it's a summary. If you can't compress the quarter to three sentences, you don't actually know what happened.
Section 2 — Posture score and trend
One headline number. One trend line. One delta against the previous quarter.
Boards are used to consuming summary metrics this way: EBITDA, NPS, churn, ARR. They don't want to evaluate seventeen input metrics and derive a conclusion; they want the conclusion with a path to drill in.
What goes on the page:
- Current composite score (0–100), rendered large, color-coded against threshold bands (red <50, amber 50–75, green 75+)
- Trend line showing last four quarters
- "Driven by" one-liner explaining the delta ("+12 from MFA rollout completion + evidence vault refresh")
- Peer benchmark if available — "87 vs. 72 median for mid-market fintech" is magic, where "87" alone is neutral
What you leave off: the 23-metric formula that produced the score. Put that in an appendix. Boards that want it will ask; boards that don't will be grateful you didn't waste the page.
The hard part is having a real composite score to report. Radius360 generates this natively — the posture score component that feeds the impact-driven dashboard becomes the number you lead with. If you're still computing it manually in a spreadsheet, that's Q2's project.
Section 3 — Top 3 risks with business impact
Three risks. Not ten. In business terms, not technical ones.
Boards consistently report that the thing they most want and least get is a real risk picture. Most CISO reports either pretend everything is fine or dump the full risk register and ask the board to prioritize (they can't — it's your job). The right answer is three risks, surfaced because they rank highest when you weight by business impact.
What goes in each risk entry:
- One-sentence description in business terms: "Vendor access review 90 days overdue" — not "TPRM-RISK-042 policy noncompliance"
- What could happen in dollars or operational terms: "Breach via a subprocessor could trigger $1.2M in contractual indemnity exposure, plus regulatory cost"
- Current status — open, mitigating, accepted, transferred
- Owner and commitment — who owns closing it and by when
The shift from CVSS scores to dollars-at-stake is the single biggest upgrade most boards need. We covered the methodology in how we rank risks: dollars at stake, not CVSS — apply that ranking to the risk register and the Top 3 surface automatically.
What you leave off: the 40-risk register. Boards don't want to see your risk register. They want to know you have one, that it's current, and that you made a judgment about what matters most.
Section 4 — Compliance progress
One table. Framework on the left, percentage on the right, trend arrow in the middle.
| Framework | Coverage | Trend | Status |
|---|---|---|---|
| SOC 2 Type 2 | 92% | ↑ | Audit in Q3 |
| ISO 27001 | 78% | ↑ | New framework, 12 month target |
| HIPAA | 88% | → | Maintenance |
Below the table, two paragraphs: what closed this quarter (3 specific wins: e.g., "vendor management policy published, access reviews automated, disaster recovery tested") and what's blocked (the honest part — where you need help from outside security).
The blocked section is the one boards actually read. Most CISOs skip it or soft-pedal it, which is a mistake. The board can unblock things you can't — budget approvals, executive cooperation, priority decisions. Tell them what's stuck and why. Framed correctly it's not "I can't do my job" — it's "here are the three decisions I need from governance to unblock the program."
For multi-client vCISO reports, the compliance page stays at the client level but each client's status gets summarized by the practice-level view. Don't try to show all clients in detail on one board deck — it dilutes every client's message.
Section 5 — Incidents and response summary
Short, structured, honest.
Structure:
- Count by severity for the quarter (e.g., "1 Sev-1, 3 Sev-2, 14 Sev-3")
- MTTD and MTTR with a reference point ("MTTD 42 min vs. 4-hour target; MTTR 8 hrs vs. 24-hour target")
- Notable incident(s) — one paragraph per significant incident: what happened, how it was detected, what we learned, what changed as a result
- Exercise results — tabletop or red team results if any were run
Boards read the incident section looking for two things: were we competent under pressure, and did we learn from it. The "what changed as a result" sentence is the highest-value content in the whole section — it shows the program adapts. If an incident didn't change anything, the implicit message is you'll have the same incident again.
What you leave off: a full incident timeline. One paragraph per incident, maximum. The timeline belongs in the IR record, not the board deck.
Section 6 — Investment asks with ROI framing
The reason most CISOs present to the board.
Most budget asks fail not because the board is stingy but because they're framed as costs, not as investments that compare favorably to alternatives. Every ask should answer three questions without the board having to dig:
- What specifically are you buying? ("24/7 MDR service via [vendor] for $45K/yr")
- What does it change about the risk picture? ("Closes the overnight detection gap — currently our MTTD triples after 6pm")
- What does not-doing-this cost? ("Industry average breach cost for our sector is $2.1M; even a 10% probability reduction justifies the spend")
The third question is the one most CISOs under-prepare. Boards approve more spend when the counterfactual is concrete ("without this, here's what we're carrying") than when it's vague ("security keeps getting more important"). For benchmarking defaults, cost of compliance 2026 has data on what peers actually spend.
One ask per board meeting is the right ceiling. Three asks at once signal you haven't prioritized. Queue the other two for next quarter with a note that they're coming — boards appreciate seeing the runway.
Section 7 — Strategic threats on the horizon
The page where you look up, not down.
Most CISO reports are backward-looking — what happened, what got fixed. The strategic threats section is the part where you show you're tracking what's coming. Three categories:
Regulatory. Pending rules that will affect us in the next 12–24 months. SEC cyber disclosure impacts, NIS2 enforcement if EU-exposed, state privacy law expansions, industry-specific (HHS 405(d), DoD CMMC milestones). One line each, with a status indicator ("monitoring / preparing / compliant").
Industry threat landscape. What's happening to peers. Named breaches, named exploited vulnerabilities, trending attack patterns ("ransomware-as-a-service groups targeting our subsector"). Boards want to know you see what's happening and adjust.
Technology shifts. AI adoption inside the company, shadow AI discoveries, supply-chain risks in key SaaS providers, identity-provider consolidation decisions. This is where you surface the AI governance conversation before the board asks. If your company is shipping AI features, this section is how the board finds out security is paying attention — not from a headline six months later.
What you leave off: your personal interesting-reads list. This is about threats that map to decisions the board may need to make in the next year, not about everything you read in your RSS feed.
Section 8 — KPI dashboard
Four to six operating metrics, not twenty. Each with a current value, a target, and a trend arrow.
Metrics that almost always earn a place:
| Metric | Why it's on the list |
|---|---|
| MFA coverage % | The single control with highest breach-prevention correlation |
| Critical/high CVE backlog older than SLA | Directly ties to cyber insurance and compliance |
| Mean time to detect (MTTD) | Proxy for detection program maturity |
| Phishing simulation click rate | Proxy for security culture |
| Evidence collection automation % | Proxy for program efficiency and audit readiness |
| Access review completion % and revocations | Proxy for IAM hygiene |
Metrics that shouldn't earn a place (unless something is unusually wrong):
- SIEM alert volume (meaningless without context)
- Firewall logs blocked (confuses volume for security)
- Number of policies published (activity, not outcome)
- Agent deployment count (quantity without quality)
The principle: board KPIs should map to things the board can act on. MFA coverage → they can approve resources to close the gap. Alert volume → they can't do anything with that.
The one-page template
Boards that have seen this format twice will start expecting it. Here's the minimal structure:
[LOGO]                          CISO BOARD REPORT — [QUARTER]
─────────────────────────────────────────────────────────────
EXECUTIVE SUMMARY
  [three sentences]
─────────────────────────────────────────────────────────────
POSTURE SCORE                   TOP 3 RISKS (business impact)
   87   ↑ +12 from Q4            1. [risk] — [$impact]
   target 90                     2. [risk] — [$impact]
                                 3. [risk] — [$impact]
─────────────────────────────────────────────────────────────
COMPLIANCE                      INCIDENTS (Q1)
  SOC 2        92%  ↑            Sev-1: 1    MTTD 42 min
  ISO 27001    78%  ↑            Sev-2: 3    MTTR  8 hrs
  HIPAA        88%  →             Notable: [one-line]
─────────────────────────────────────────────────────────────
THE ASK
  [what] — [$amount] — [what it buys]
─────────────────────────────────────────────────────────────
STRATEGIC THREATS ON THE HORIZON
  Regulatory:  [1 line]
  Industry:    [1 line]
  Technology:  [1 line]
─────────────────────────────────────────────────────────────
KPI DASHBOARD
  MFA coverage       98%   ↑  target 100%
  CVE backlog (H/C)  4     ↓  target 0
  MTTD               42m   ↓  target <60m
  Phish click rate   2.1%  ↓  target <3%
One page. Fifteen minutes. Three decisions supported.
What the Board Report Generator produces
Radius360's Board Report Generator produces exactly this structure from live tenant data — posture score, top risks ranked by business impact, compliance progress, incidents summary, and a KPI dashboard pulled from the integrations layer. The 15-minute report that used to take a full day to prepare is a single button in the product. If you're a vCISO preparing board reports across 5–10 clients simultaneously, that compression is the difference between sustainable practice economics and unsustainable ones.
For a first-pass version without the platform, use the one-page template above, fill it from whatever sources you have (spreadsheets are fine — the structure is what matters), and run it past the board next quarter. The format earns its credibility the first time a director says "this is the clearest security report we've had."
Building your first board deck and want feedback on it? support@radius360.co — I'll review it.
See how Radius360 helps
Put these ideas into practice with the right tooling.
See the Board Report Generator